Hi! I Also Enjoy Gerunds / A Message From Your Saliva
- Download the printable zine (PDF)
- Download the zine for the screen (PDF)
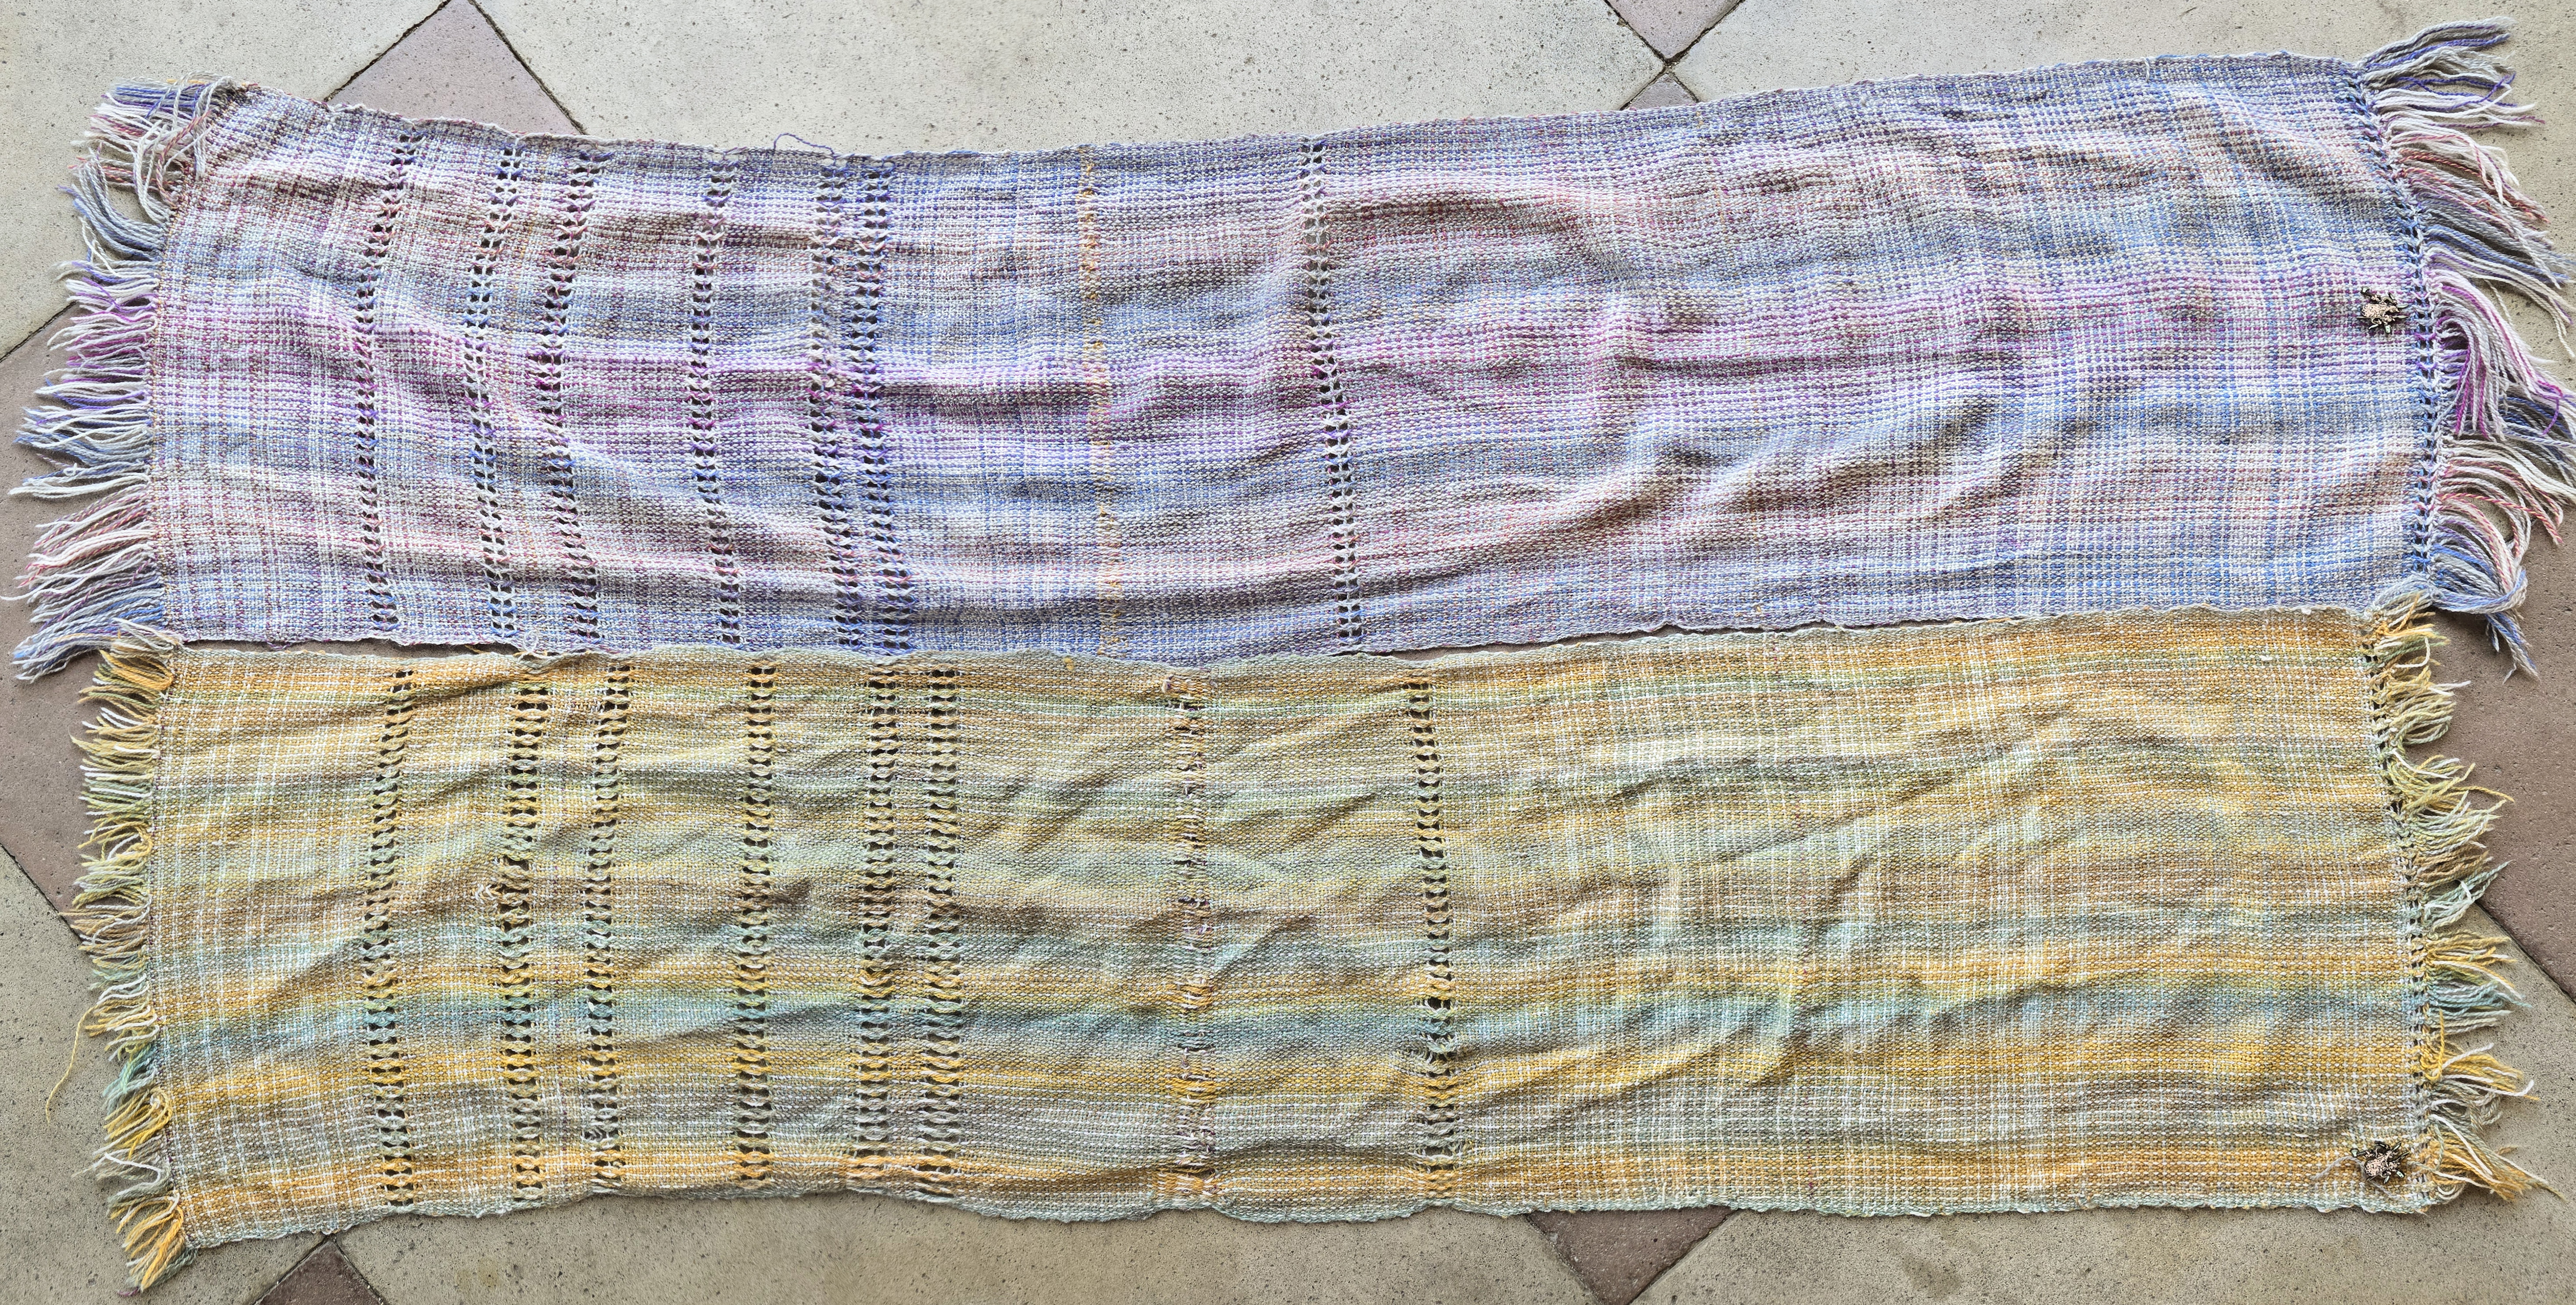
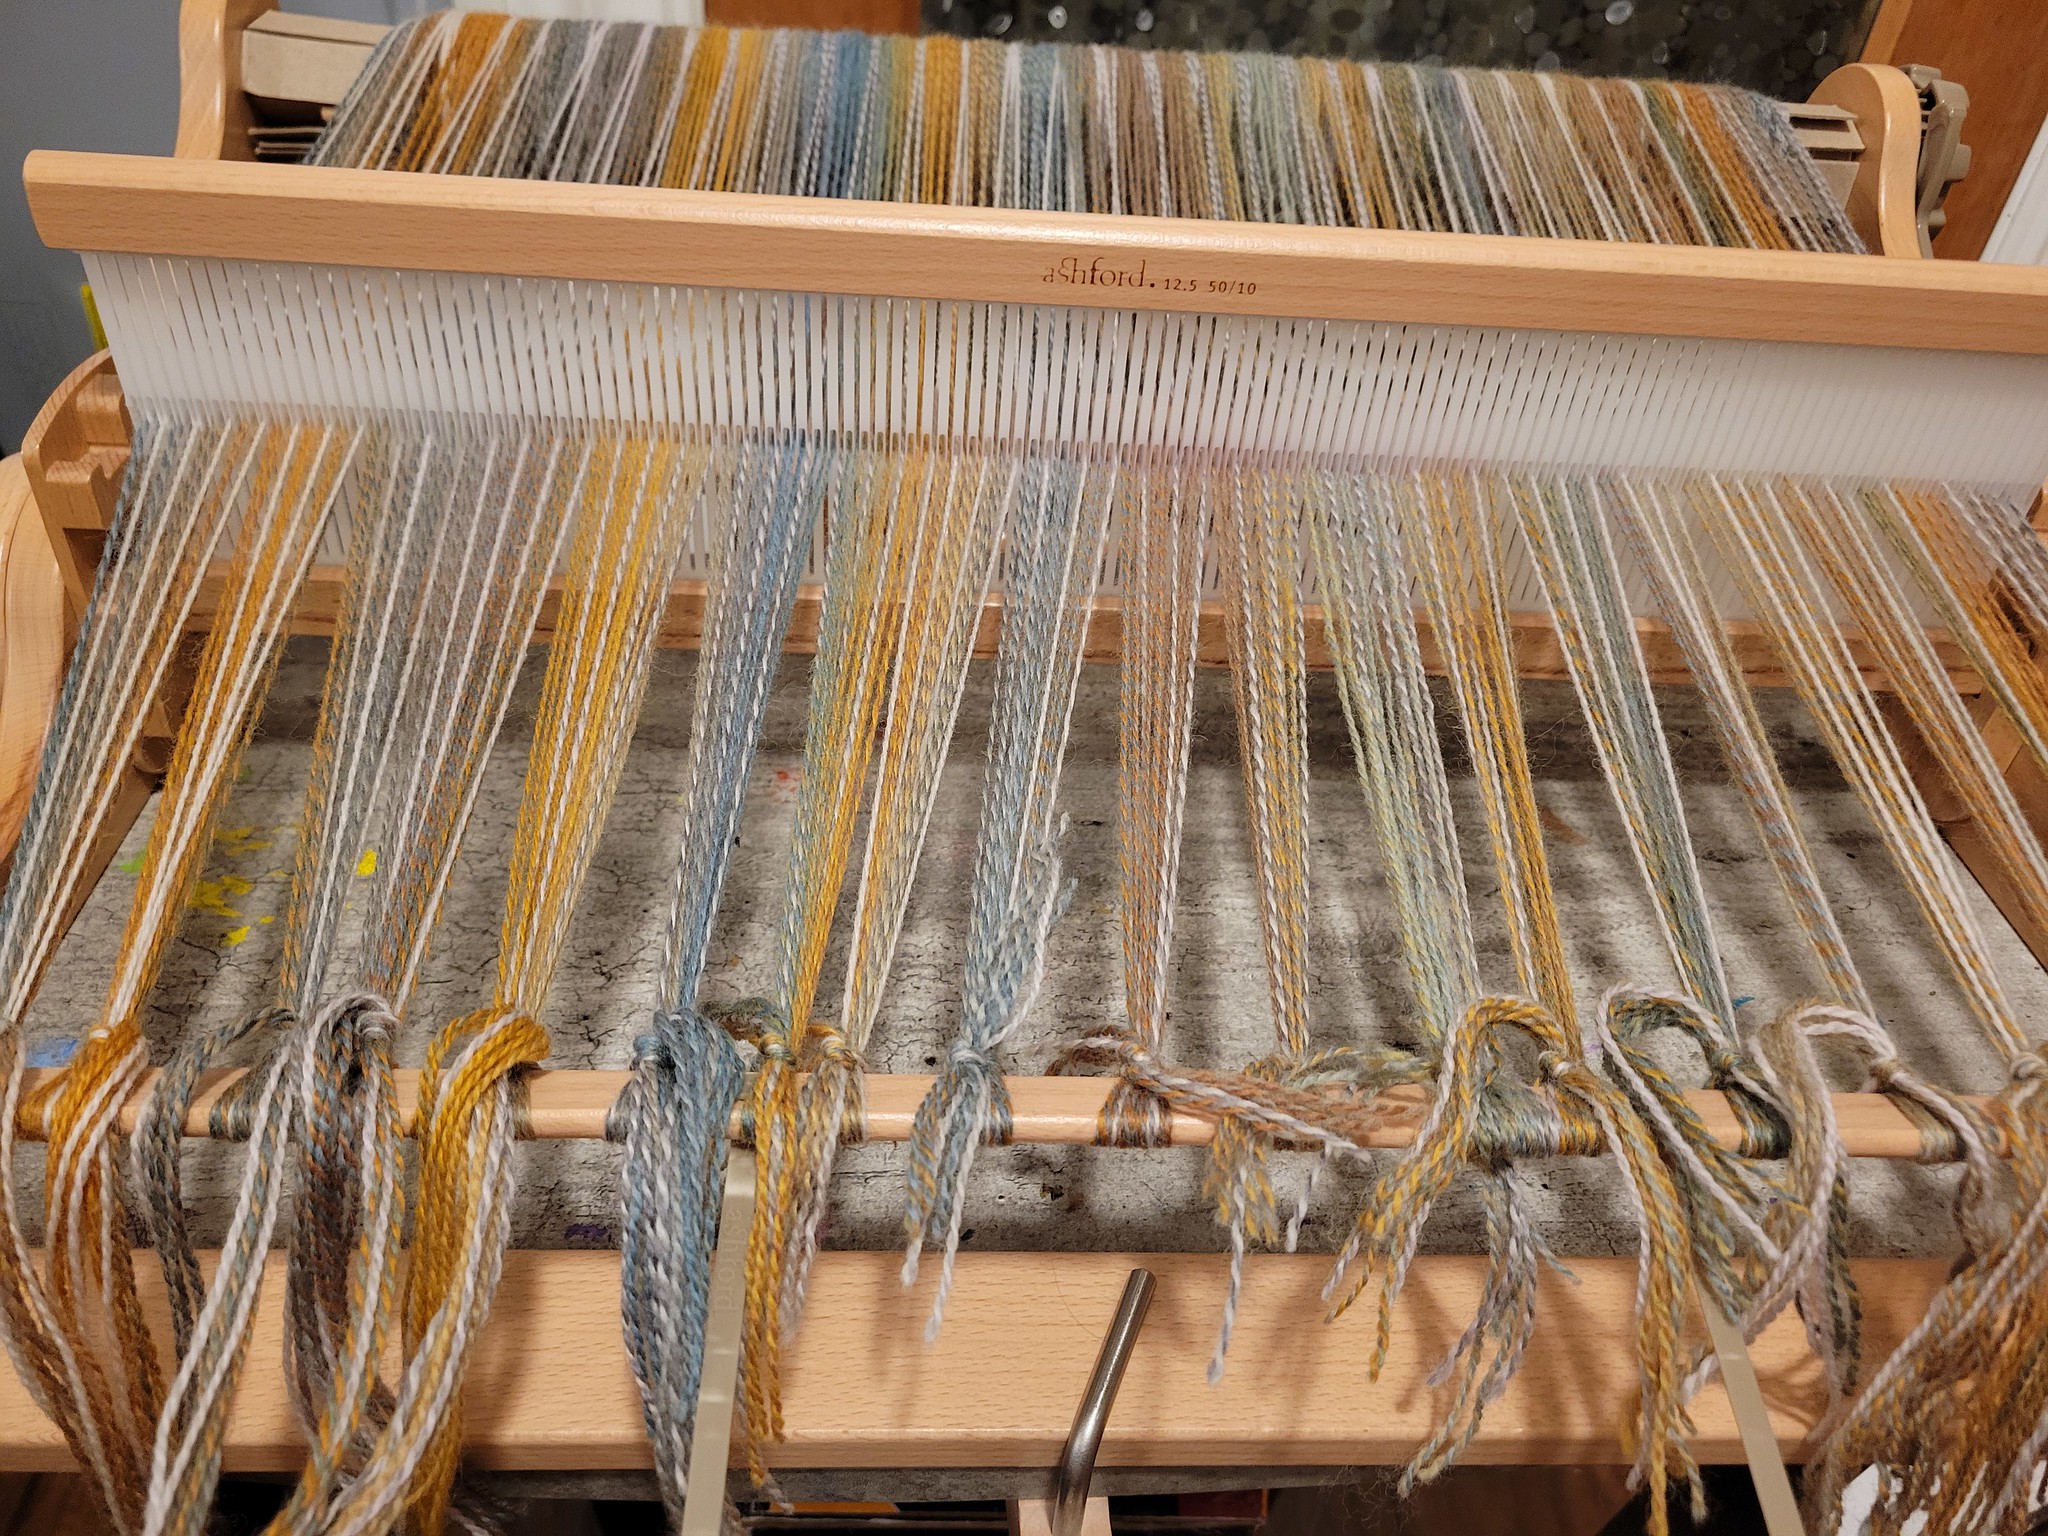
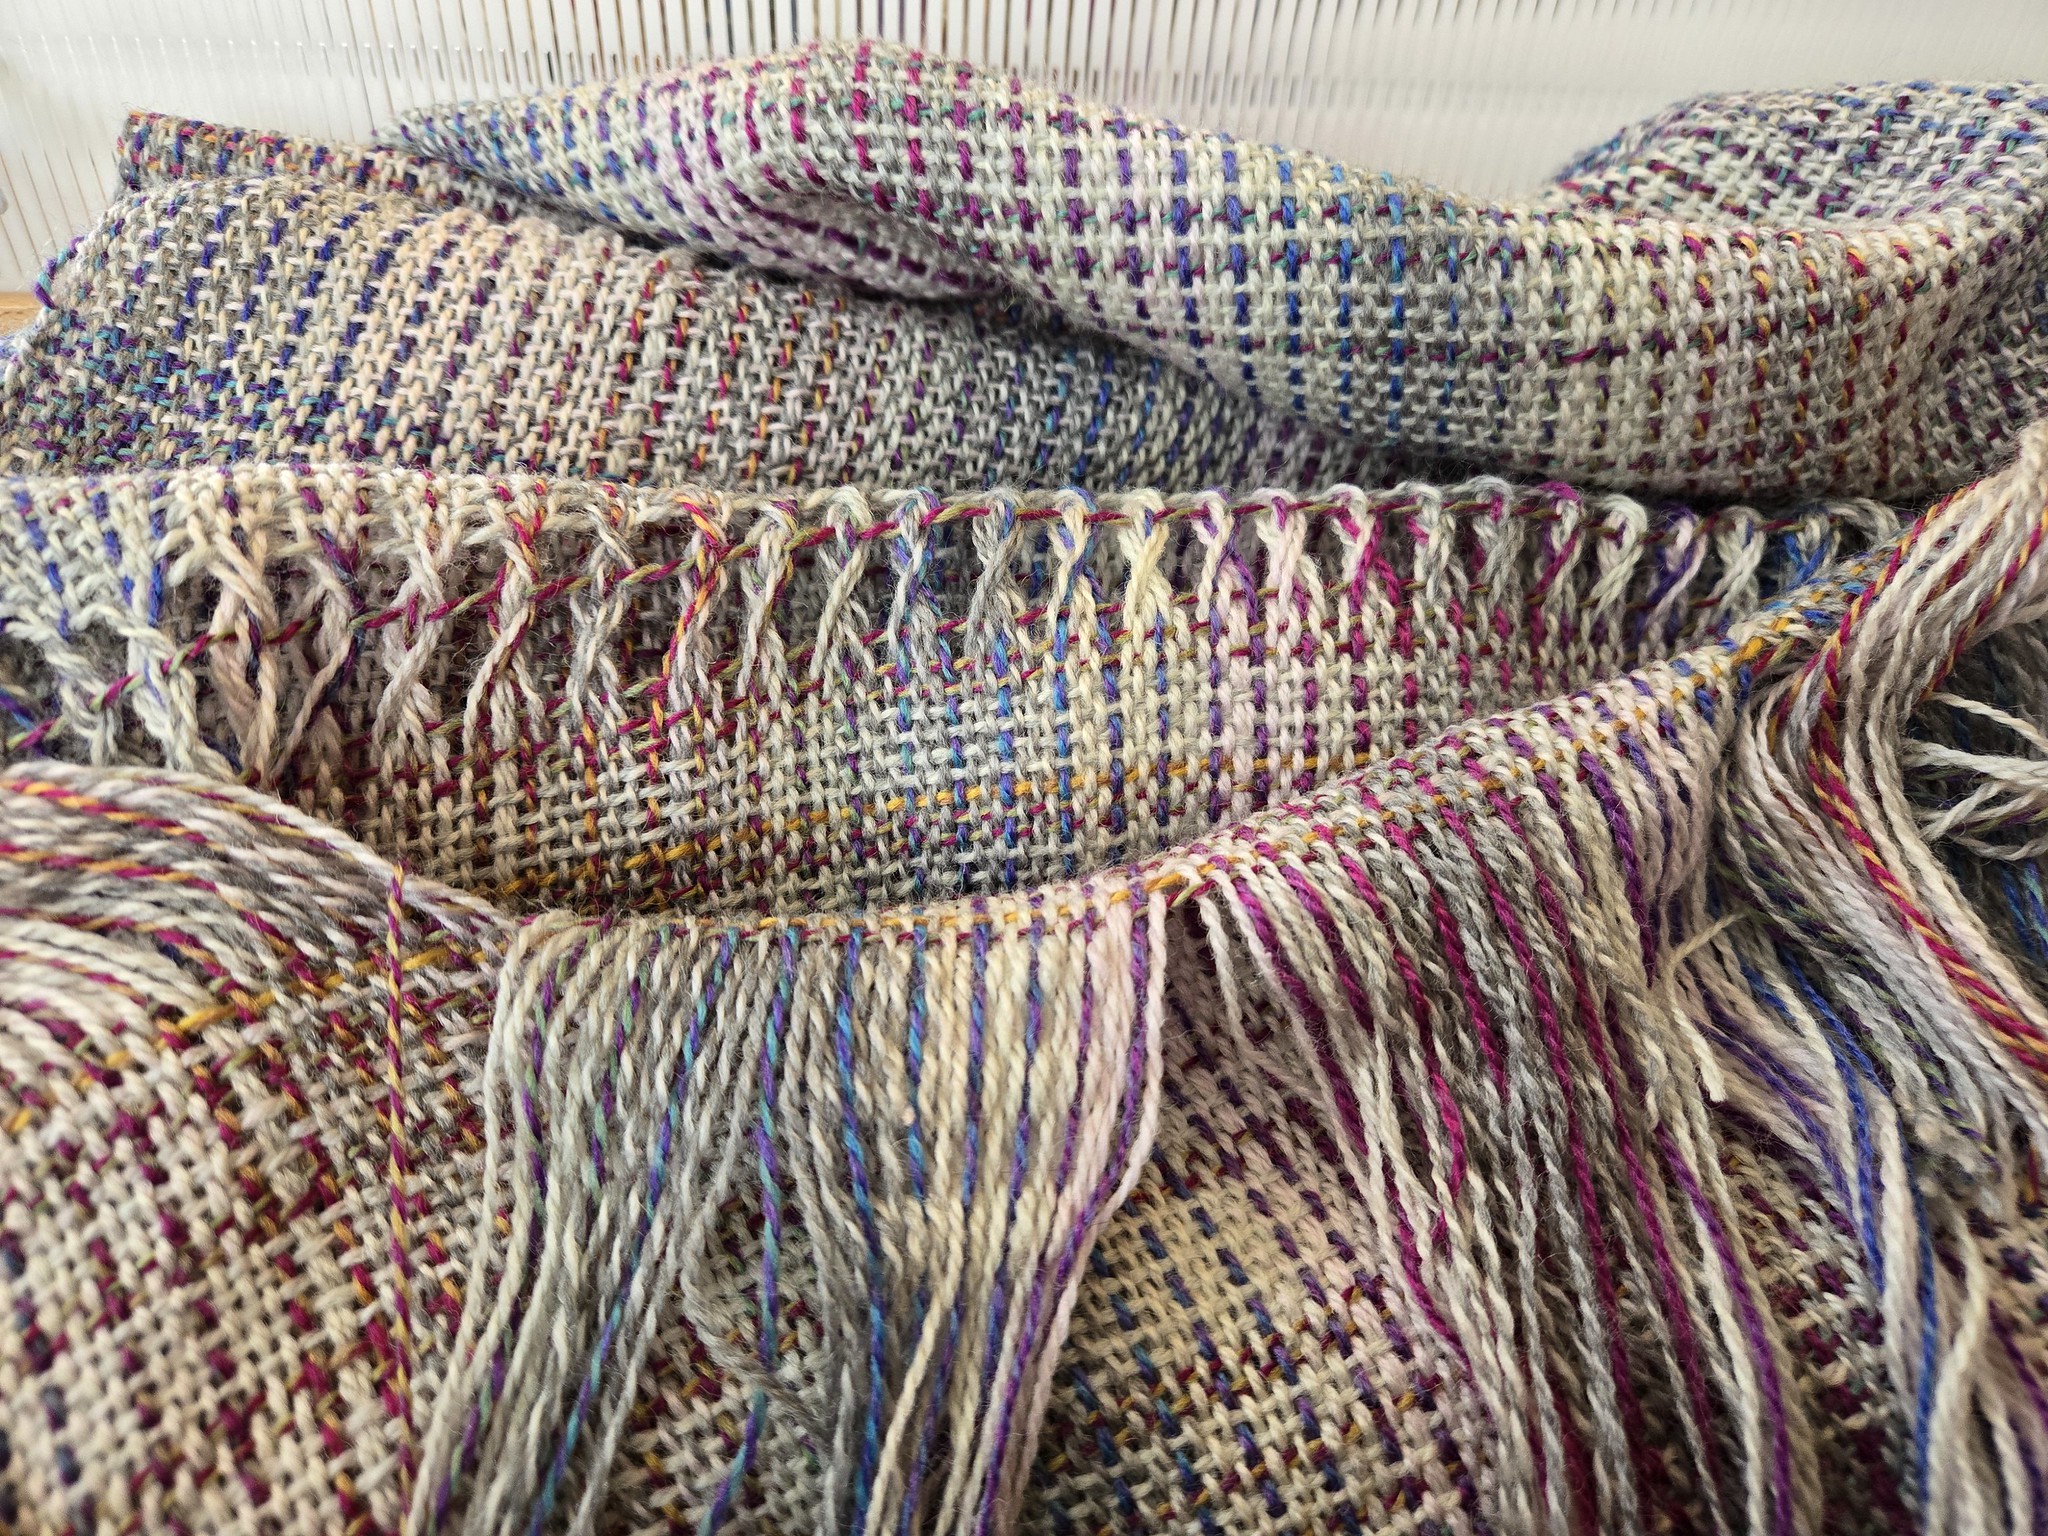
This pair of scarves was the first time I wove data twice. It captures the first 3.5 days of messages between myself and my girlfriend, between February 23-27, 2024. I reread (with my own eyeballs) the messages and created a spreadsheet of who sent which message, also noting down photos exchanged (and who sent them), and what we talked about. I was able to fit 514 messages into the length of the warp I created, where the colors represent the proportion of messages I sent vs. those she sent. My scarf is named after the first of these messages (sent by me); hers is named after the last (sent by her).
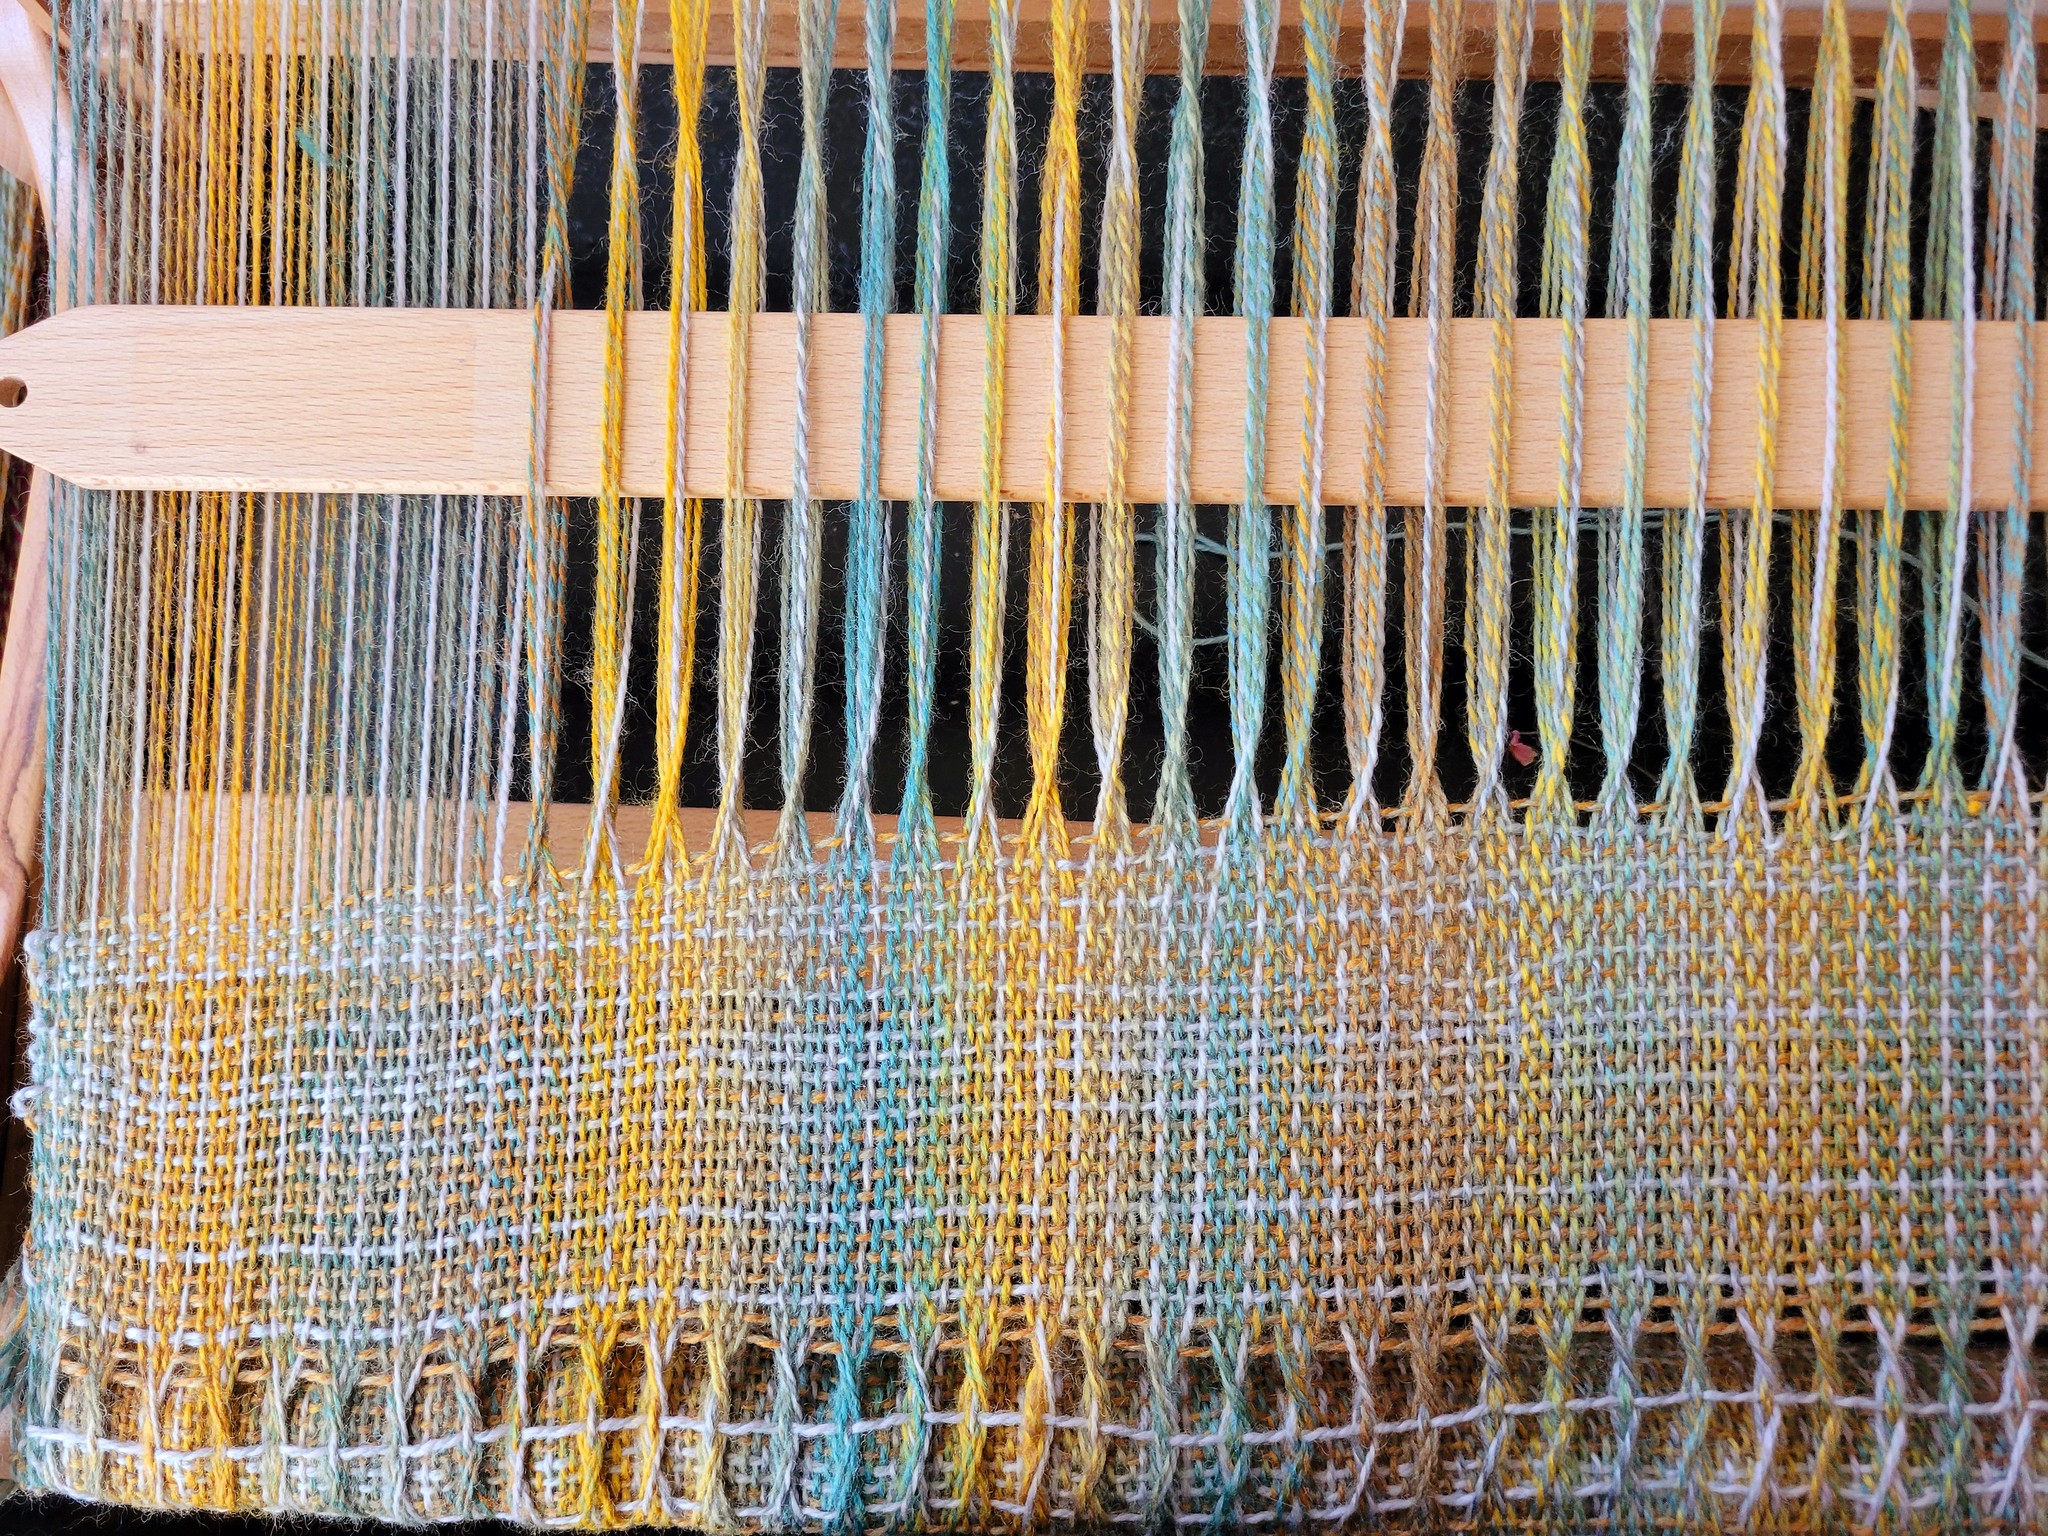
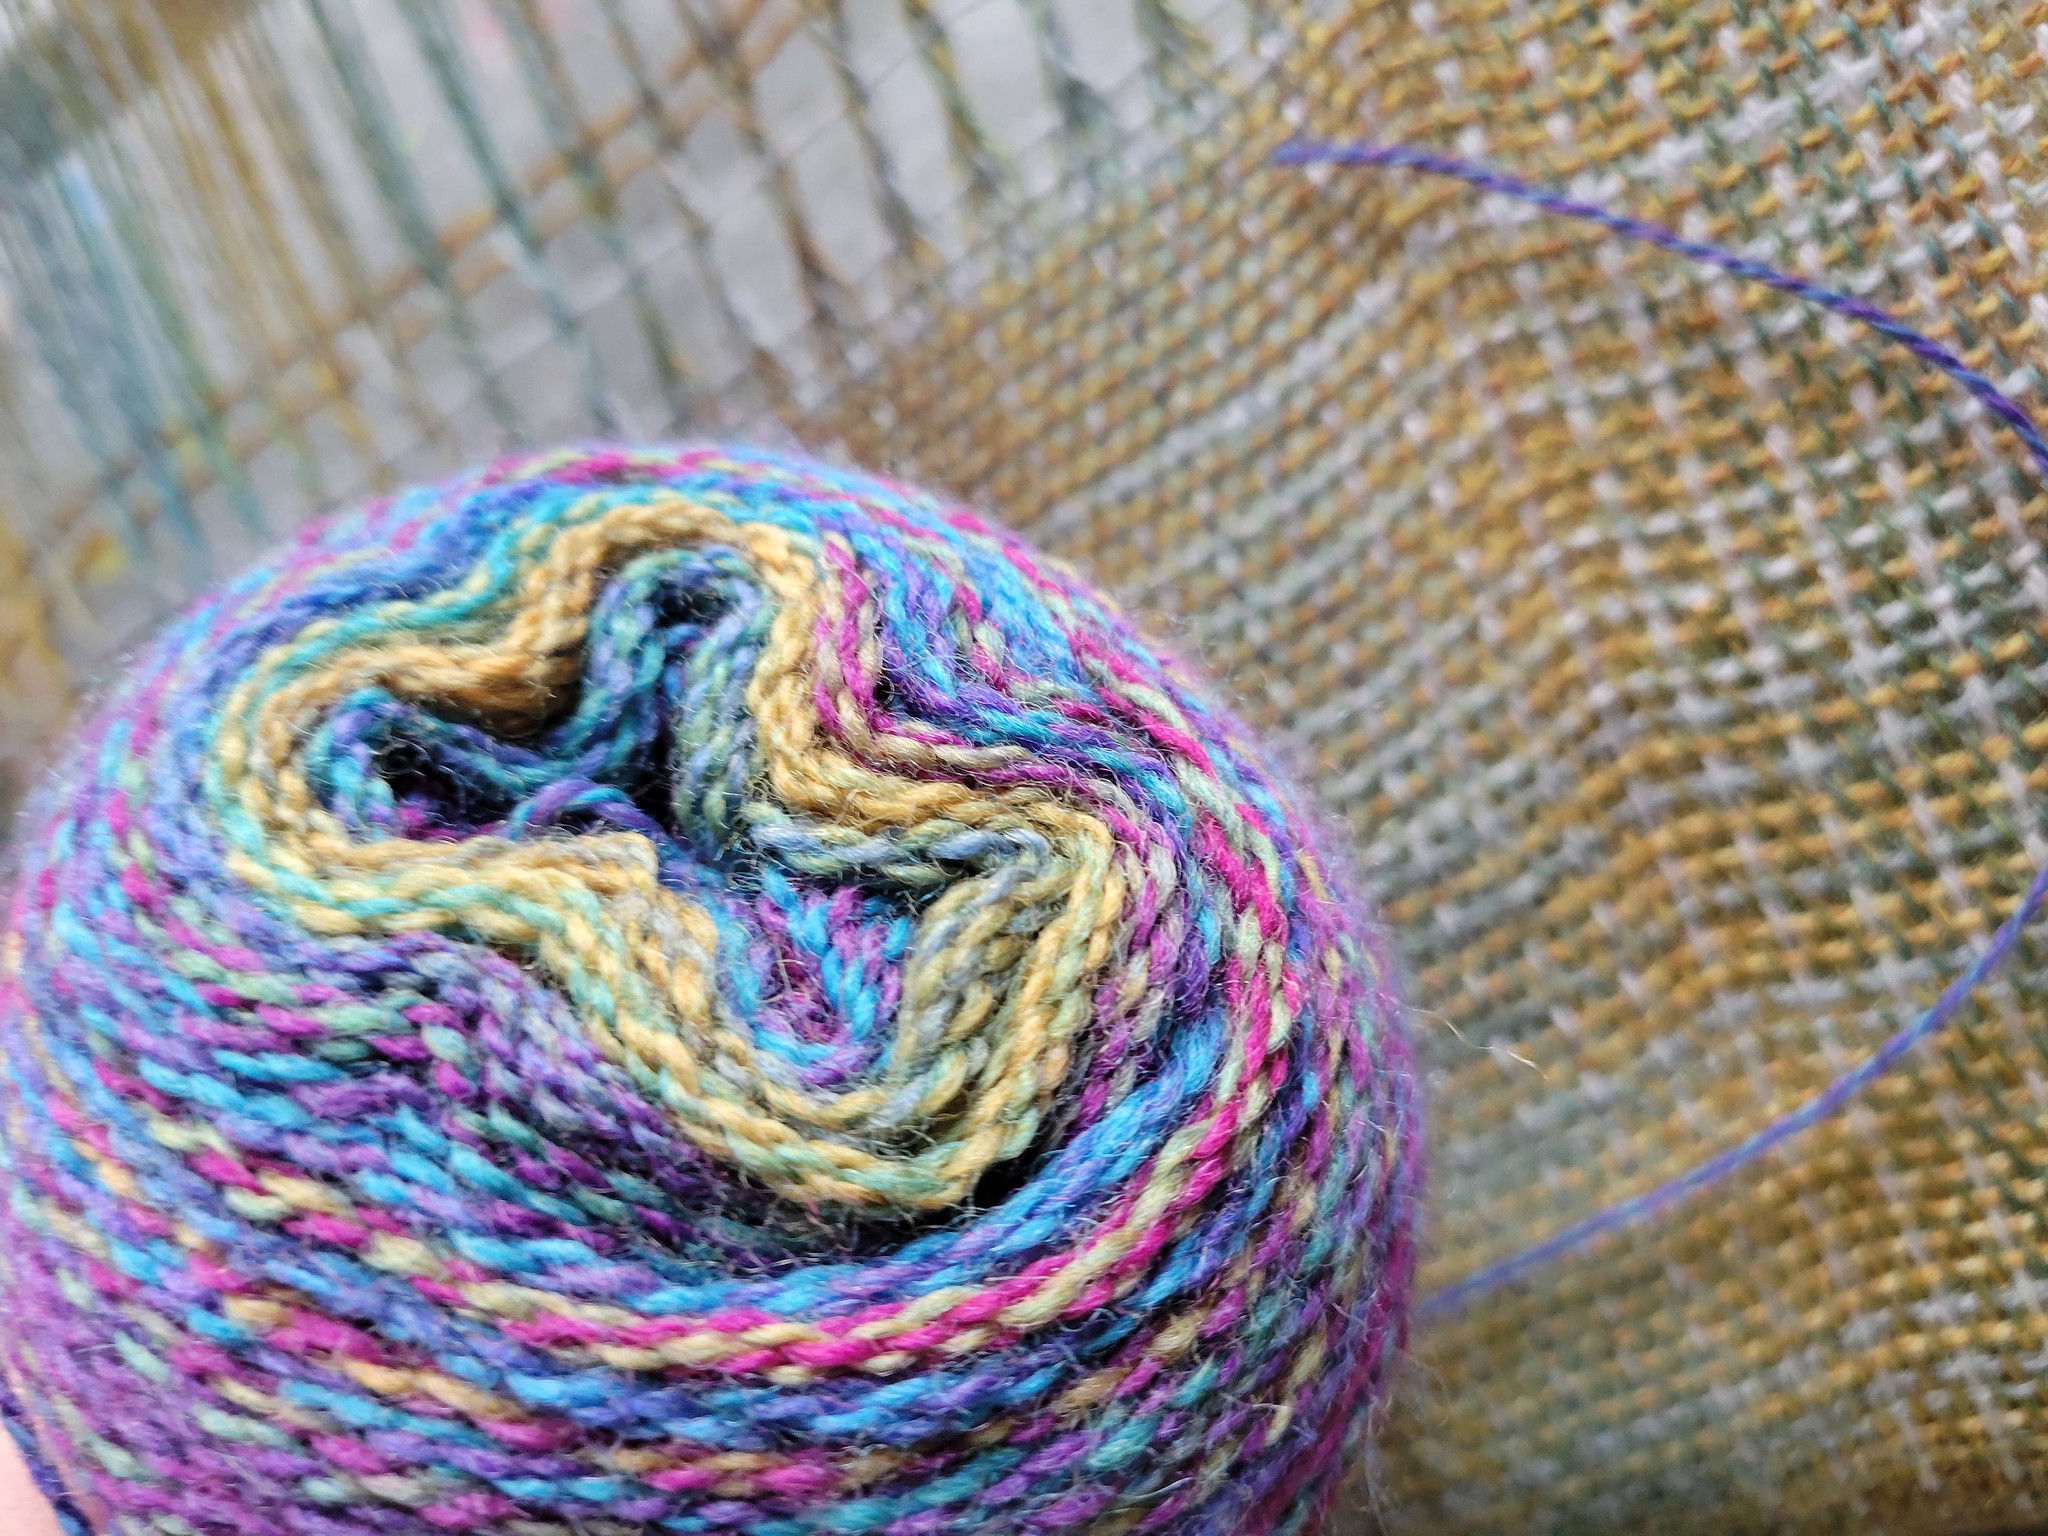
The first scarf (which I started weaving in early April 2024) was for her: her messages in green/brown, mine in gray. Leno twists represent photos, with the sender's color in the middle. When I finished her scarf, I tied the yarn for mine directly onto the waste yarn from hers: my messages in purple, hers in gray. I finished both in May 2024.
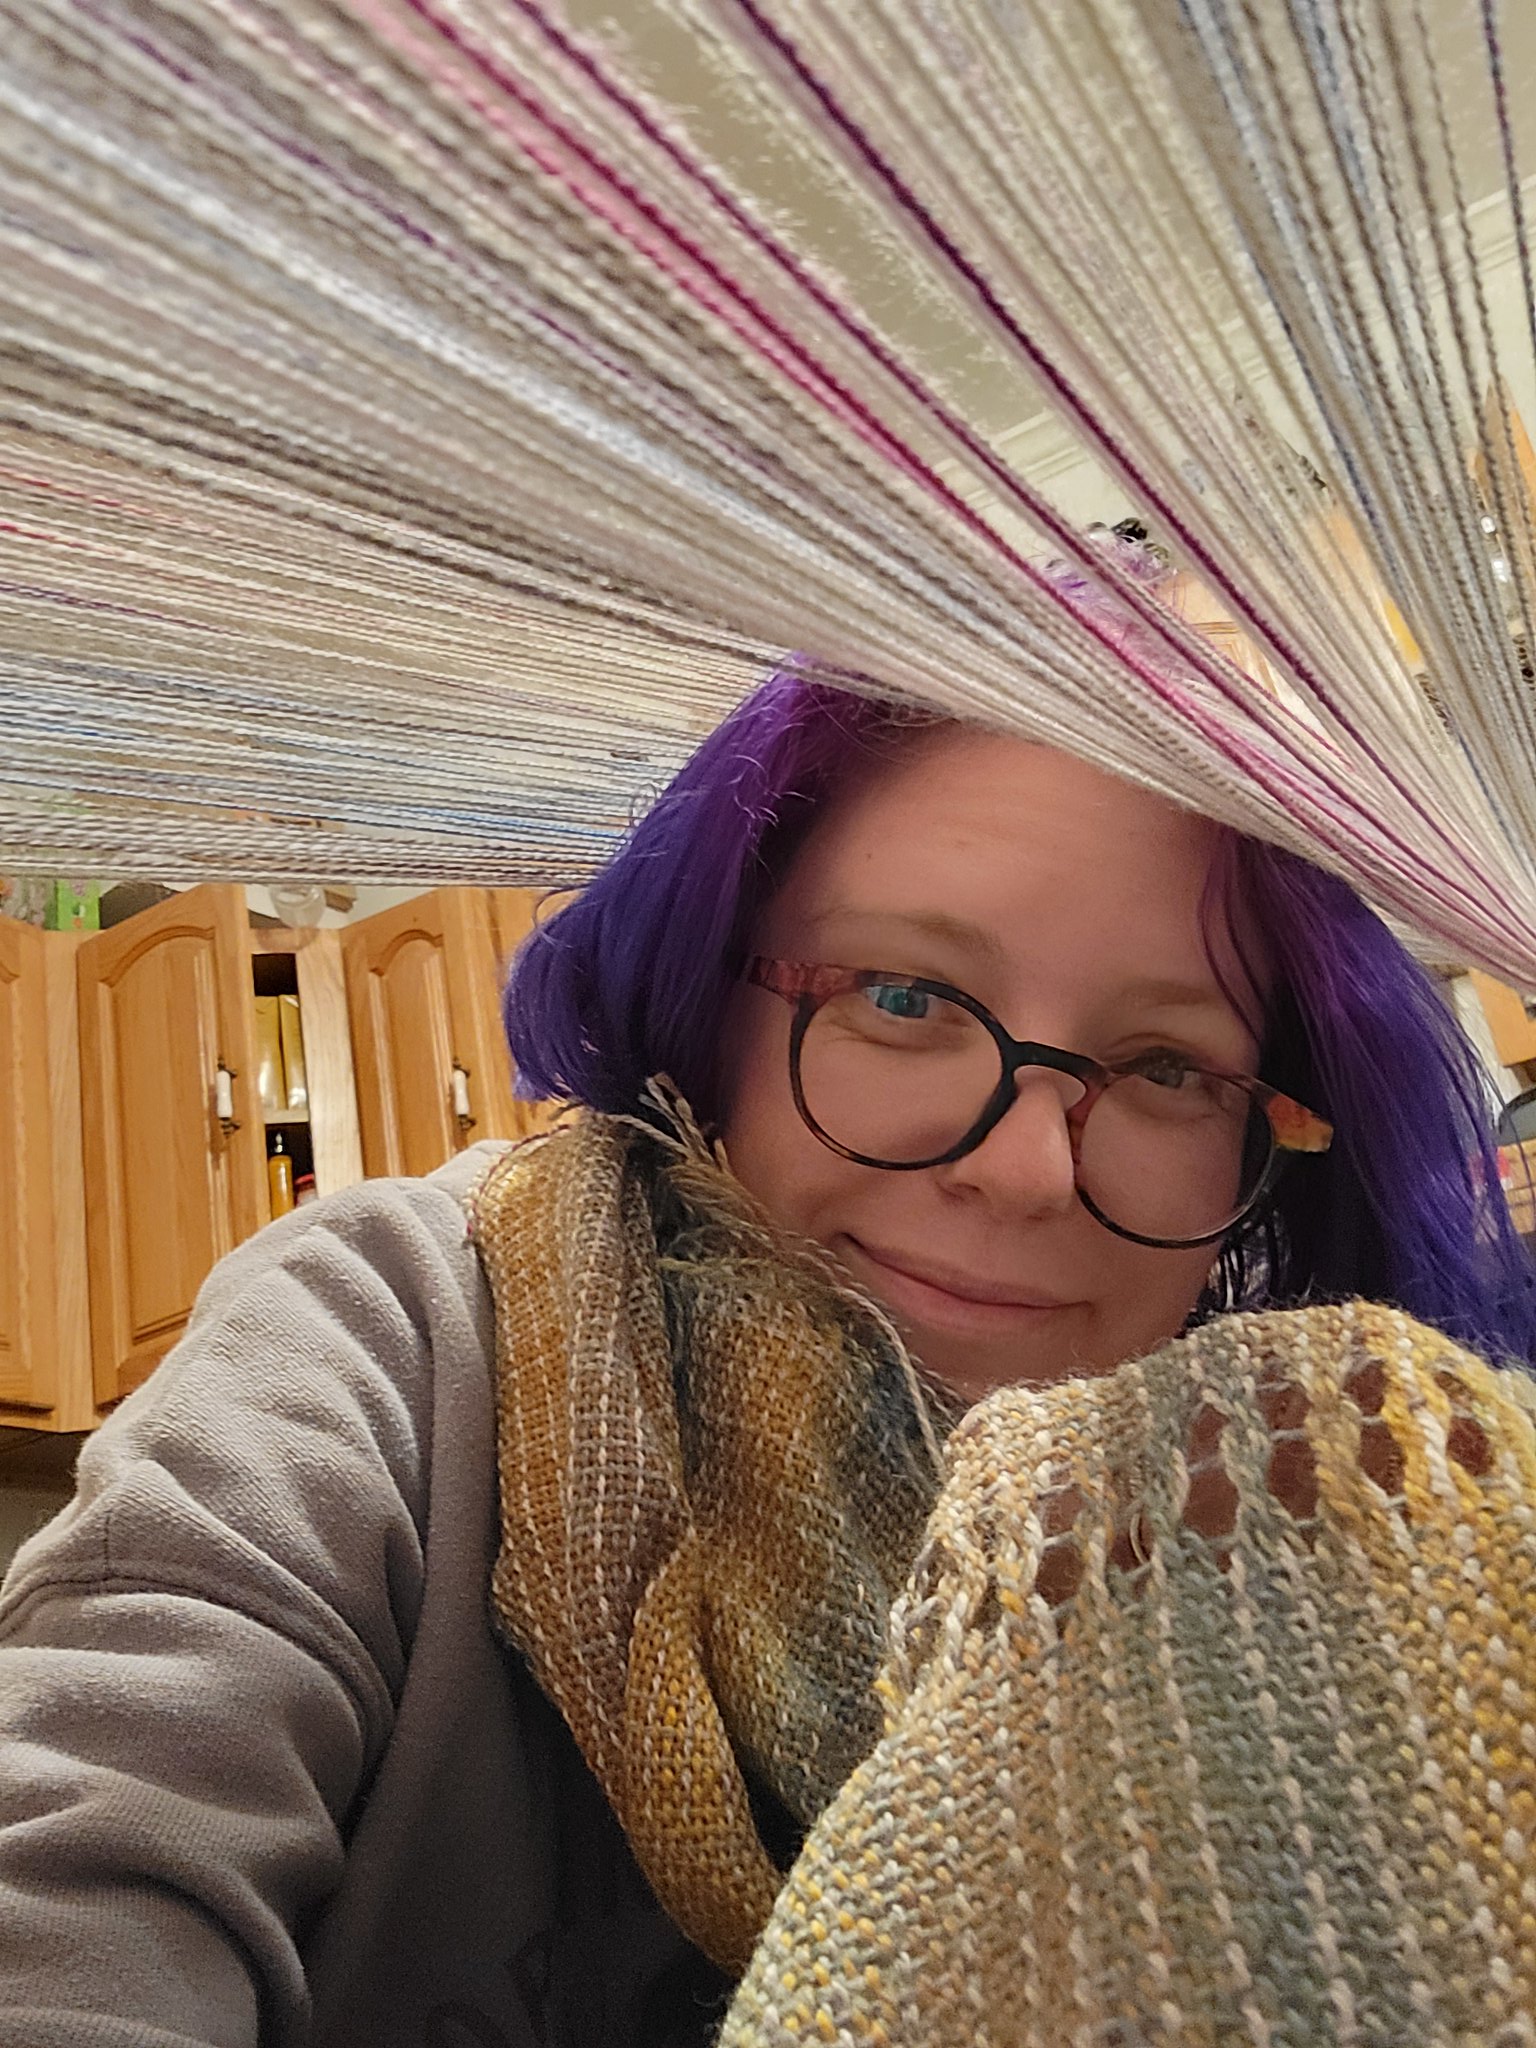
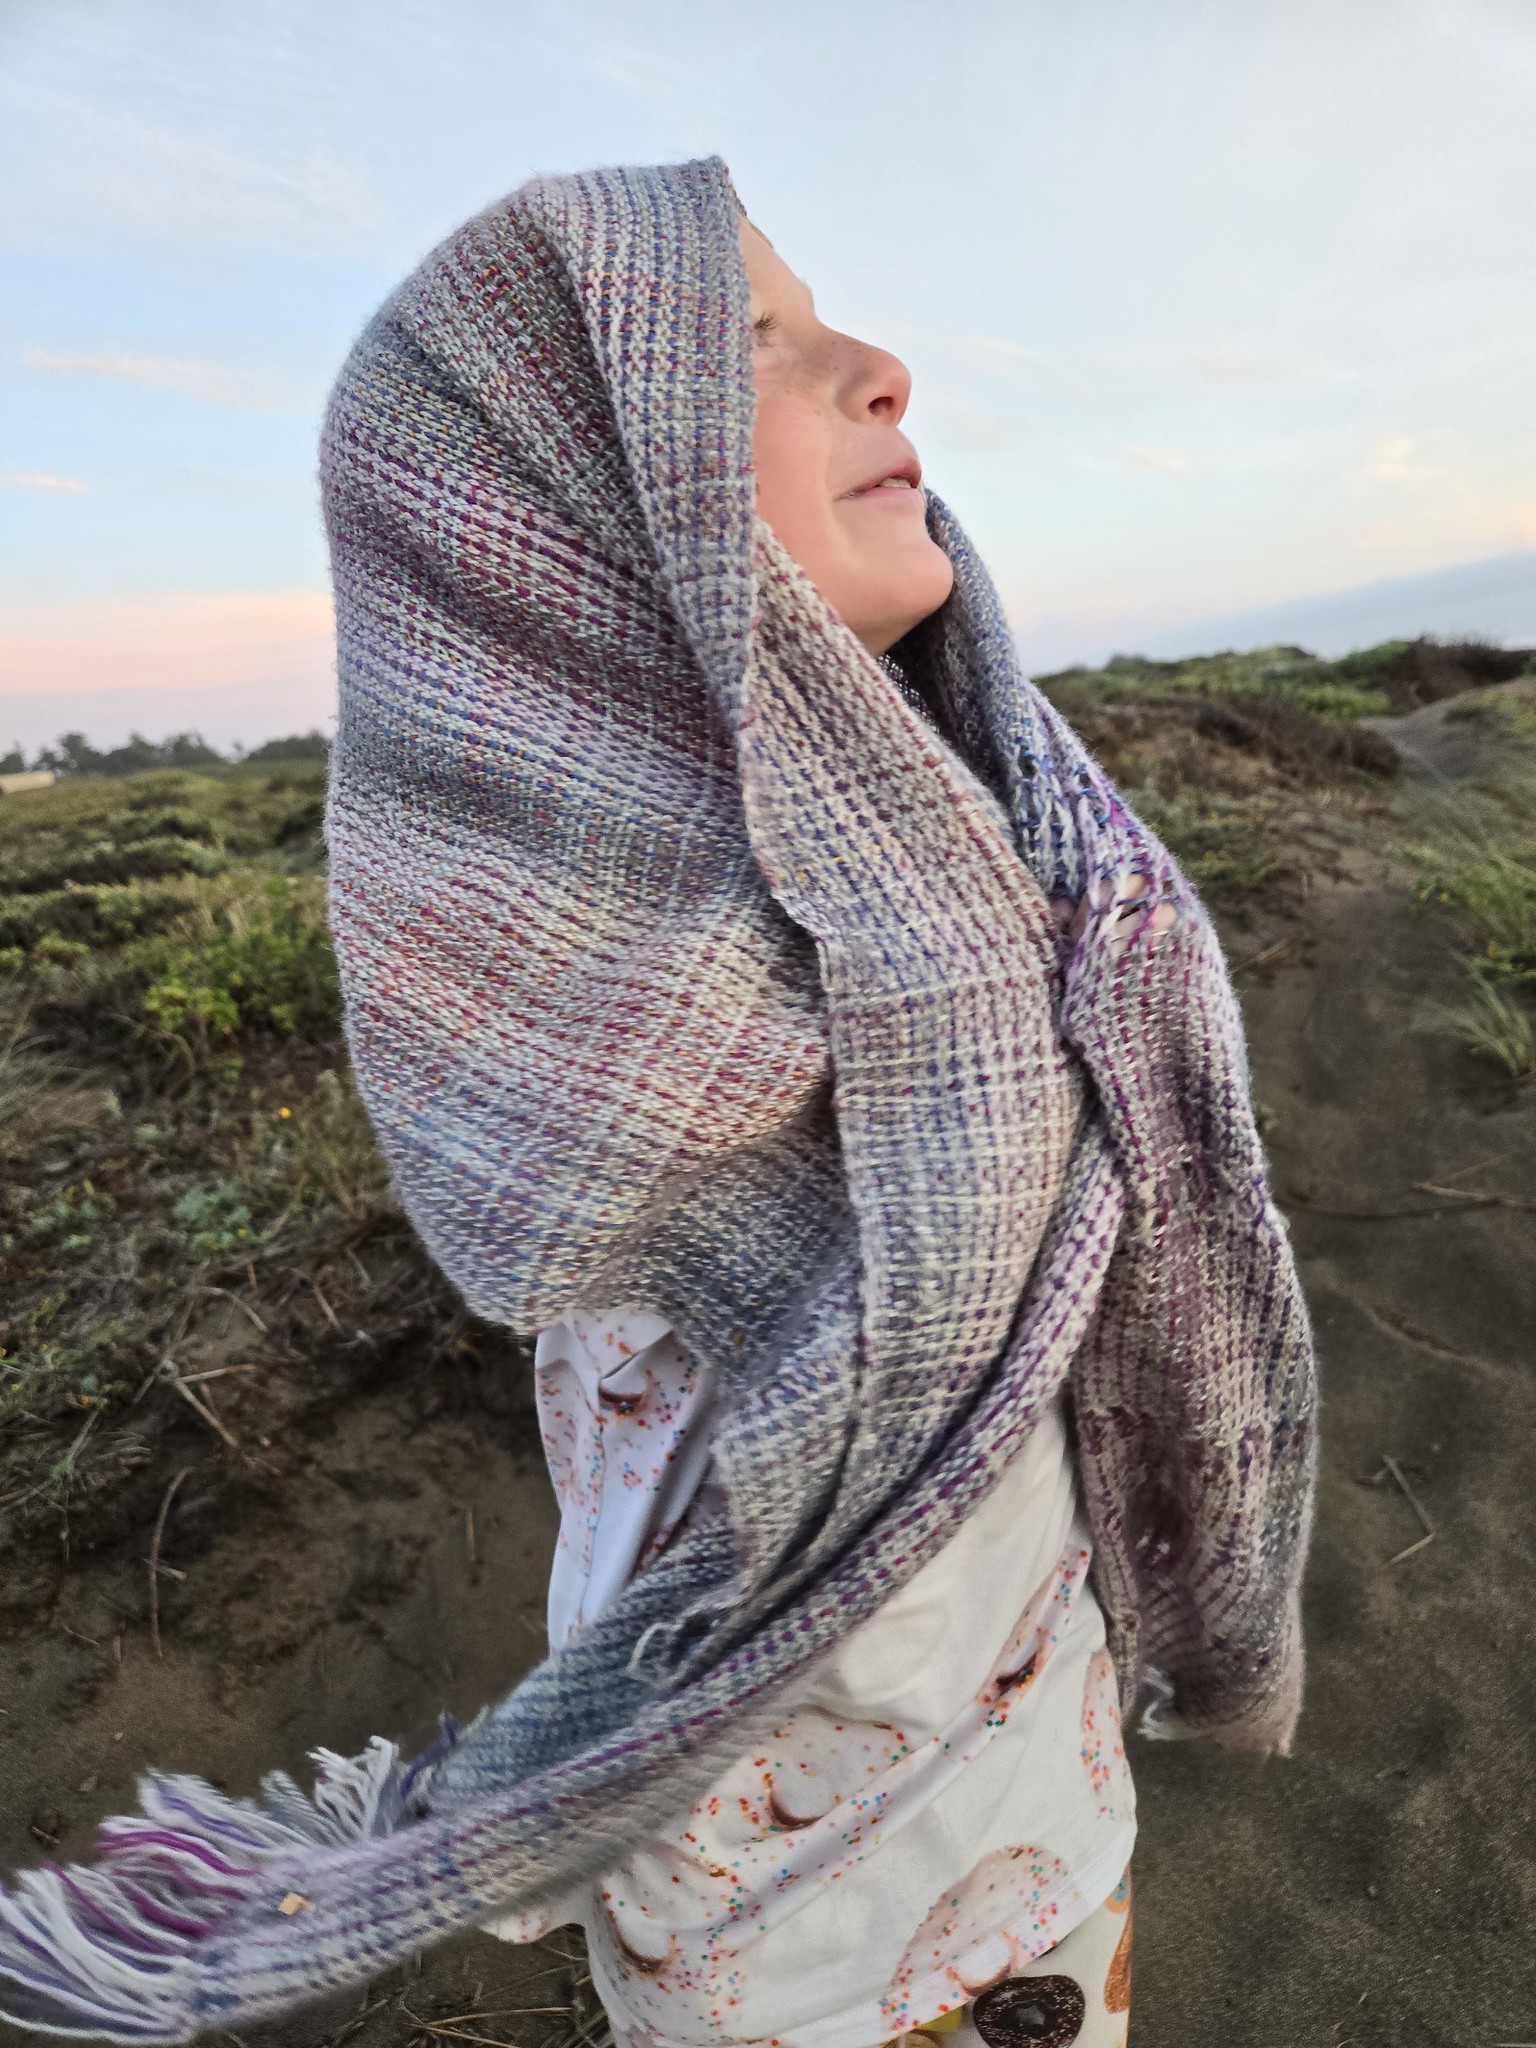
Both scarves and the accompanying zine were part of the 2024 Data Visualization with Textiles Showcase in Stanford Libraries. But they're also functional, everyday objects in our lives. We wear them often, and wrap them around our children when they're cold. I'll often use mine (because it's usually on hand) to explain what data visualization with textiles can look like, beyond the temperature blanket.
Production photos
